Thin S3 wrapper that dispatches to plot_boundary or
plot_surface depending on plot.type.
Arguments
- x
An
svmodt_nodereturned bysvm_split.- y
Ignored; present only to satisfy the
graphics::plotgeneric signature.- ...
Currently unused.
- data
The original training data frame (required).
- response
Character string naming the response column (required).
- plot.type
One of
"surface"(default) or"boundary".- features
Length-2 character vector of axis features (
"surface"only; default uses root node features).- max_depth
Maximum depth to visualize (
"boundary"only; defaultNULL= full tree).- check_accuracy
Logical; show per-node accuracy (
"boundary"only; defaultTRUE).- resolution
Grid resolution per axis. Default
100for"boundary",200for"surface".
Value
"boundary": invisibly returns the list fromplot_boundary."surface": invisibly returns the ggplot2 object fromplot_surface.
Examples
# \donttest{
tree <- svm_split(wdbc, response = "diagnosis", max_depth = 3)
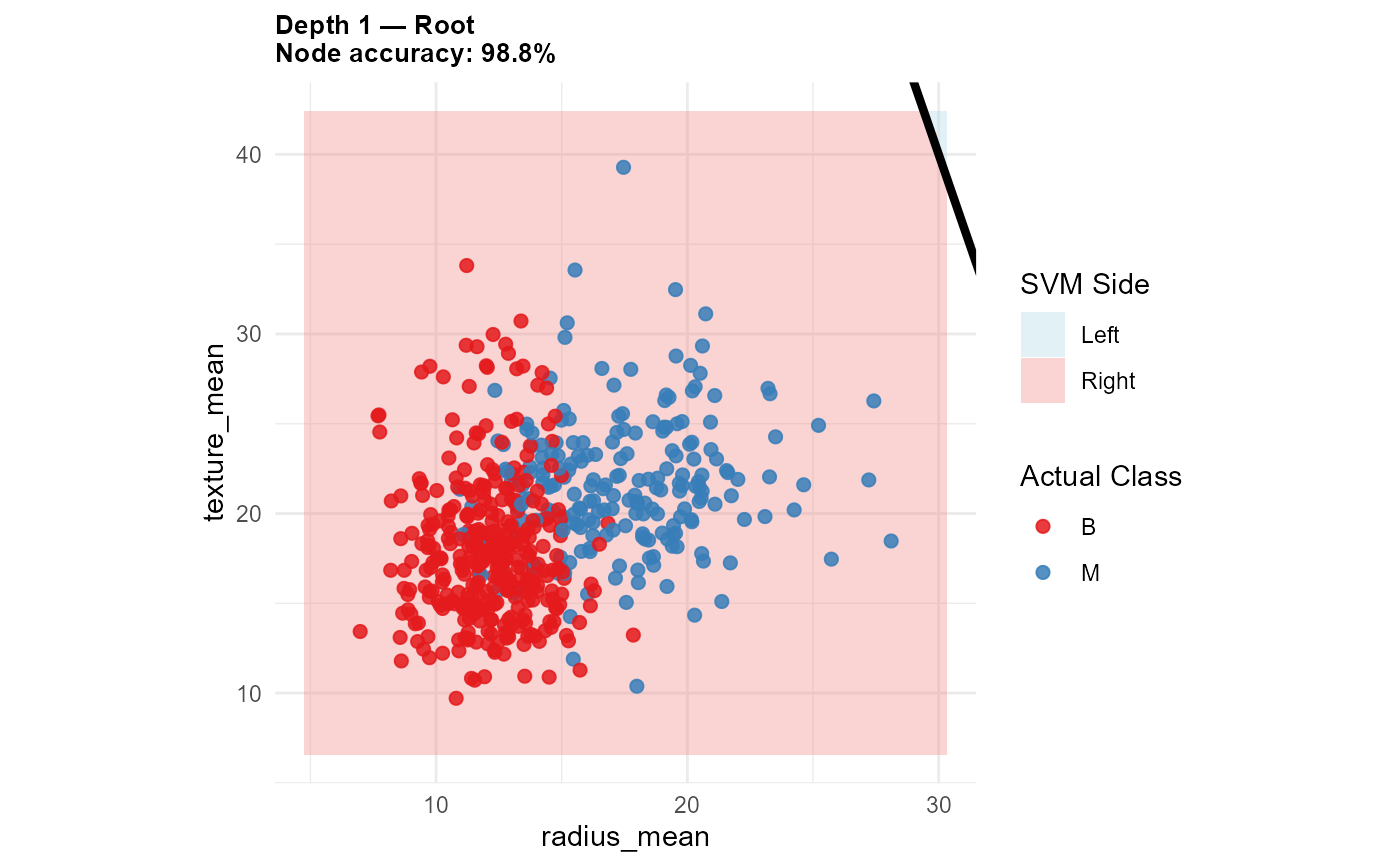
# All-node boundary panels - prints first, returns list
viz <- plot(tree,
data = wdbc, response = "diagnosis",
plot.type = "boundary"
)
#> $depth_1_Root
 #>
#> $depth_2_Root_L
#>
#> $depth_2_Root_L
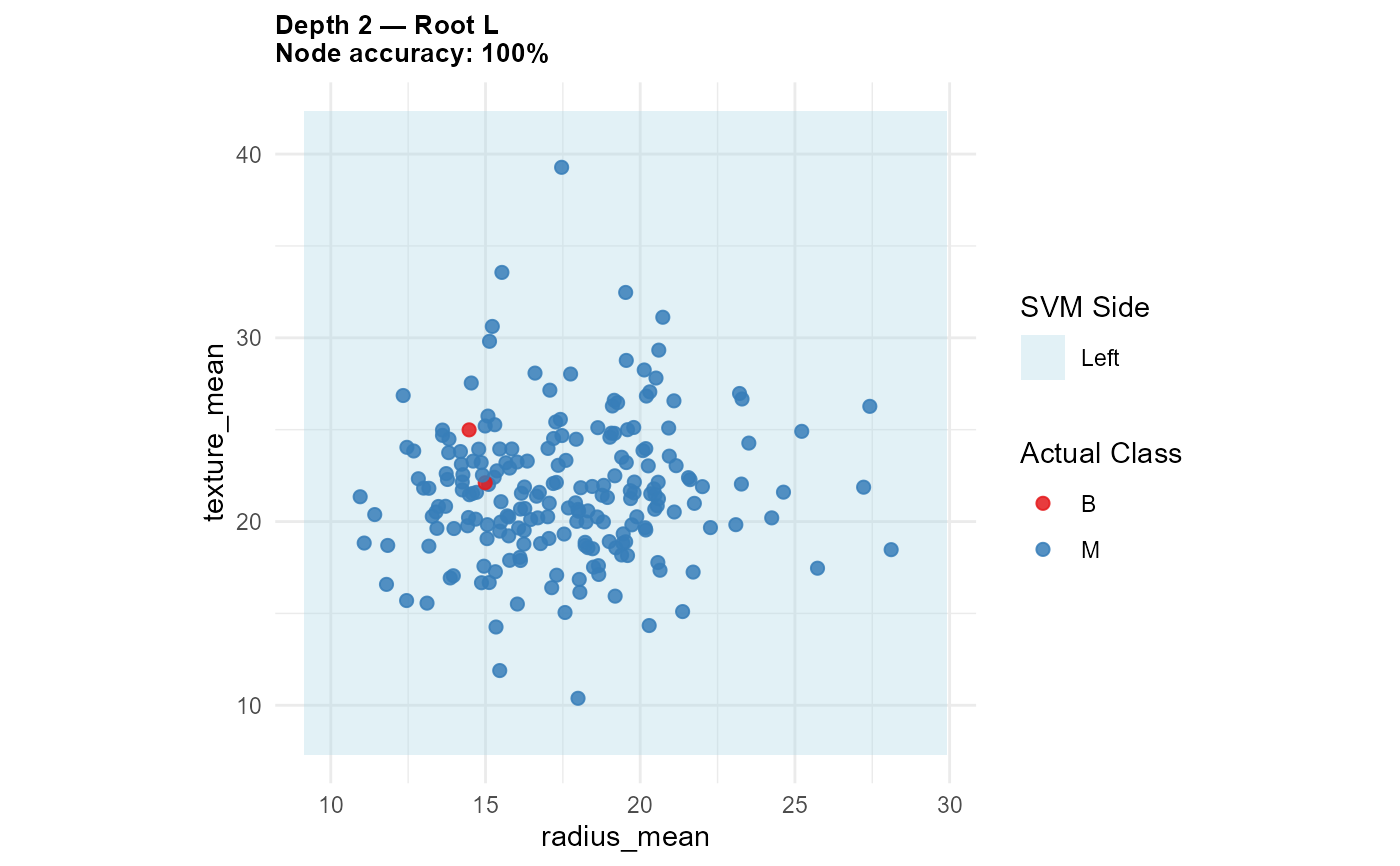 #>
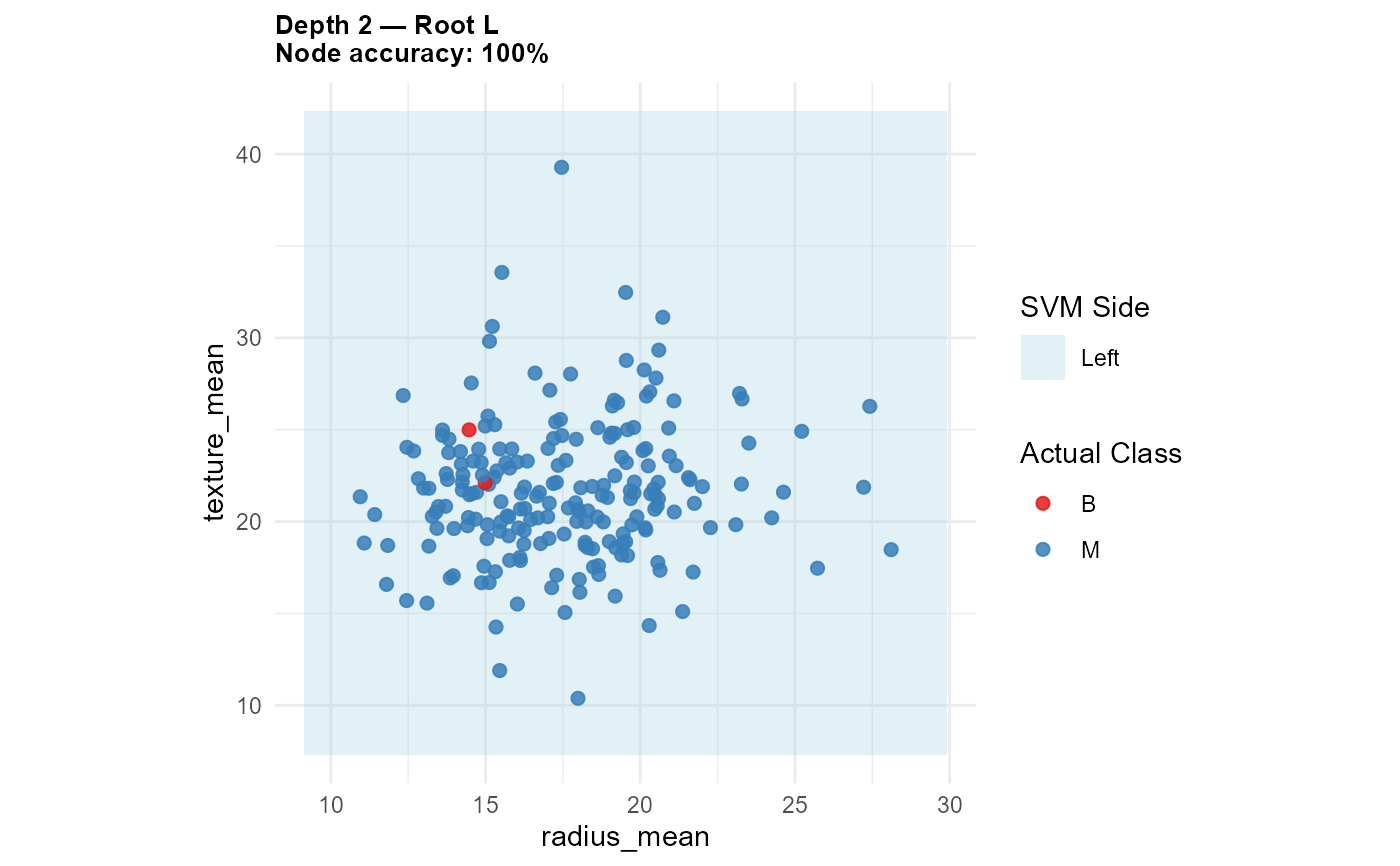
viz$plots[[2]] # second node
#>
viz$plots[[2]] # second node
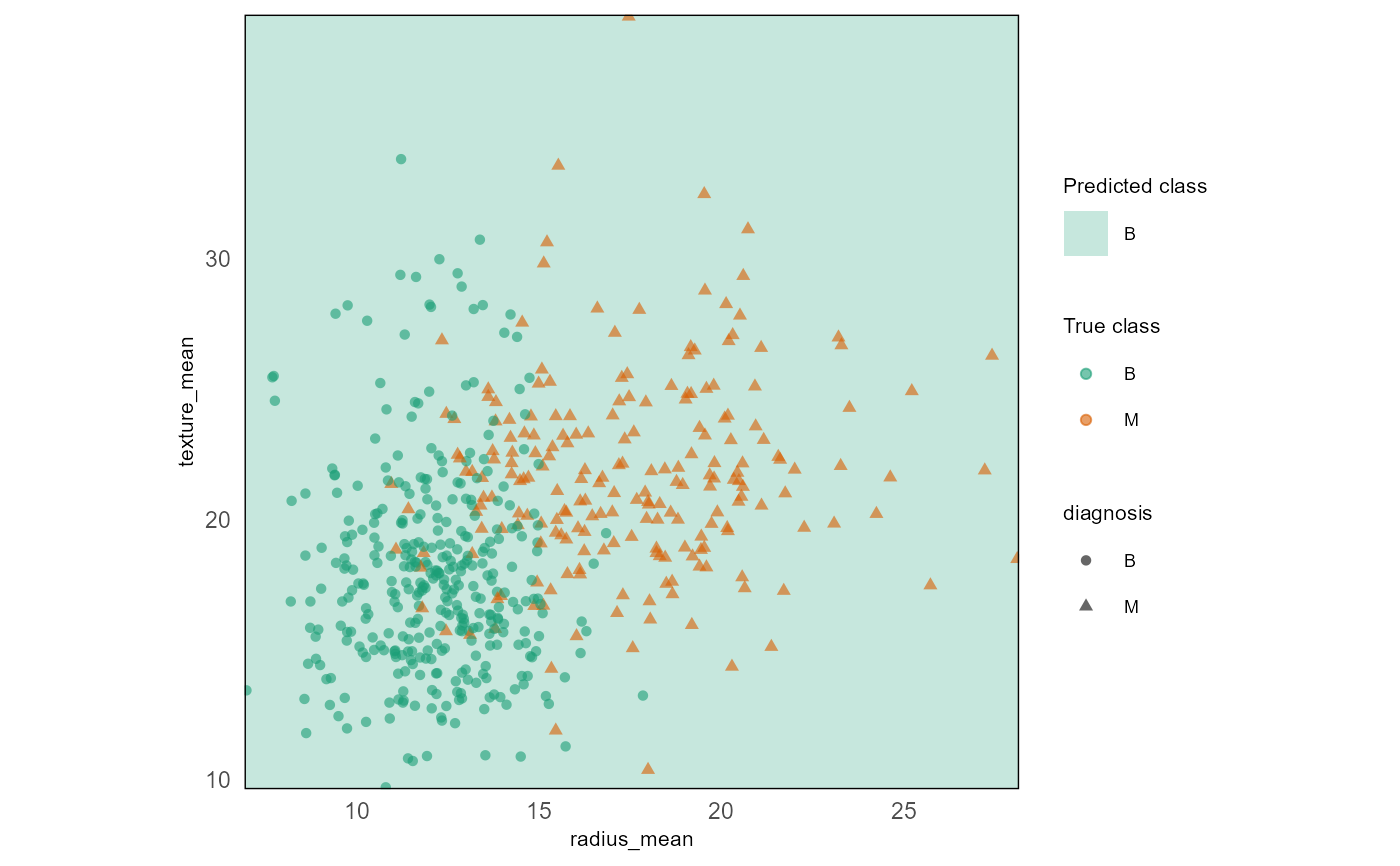
 # Global decision surface
plot(tree,
data = wdbc, response = "diagnosis",
plot.type = "surface"
)
# Global decision surface
plot(tree,
data = wdbc, response = "diagnosis",
plot.type = "surface"
)
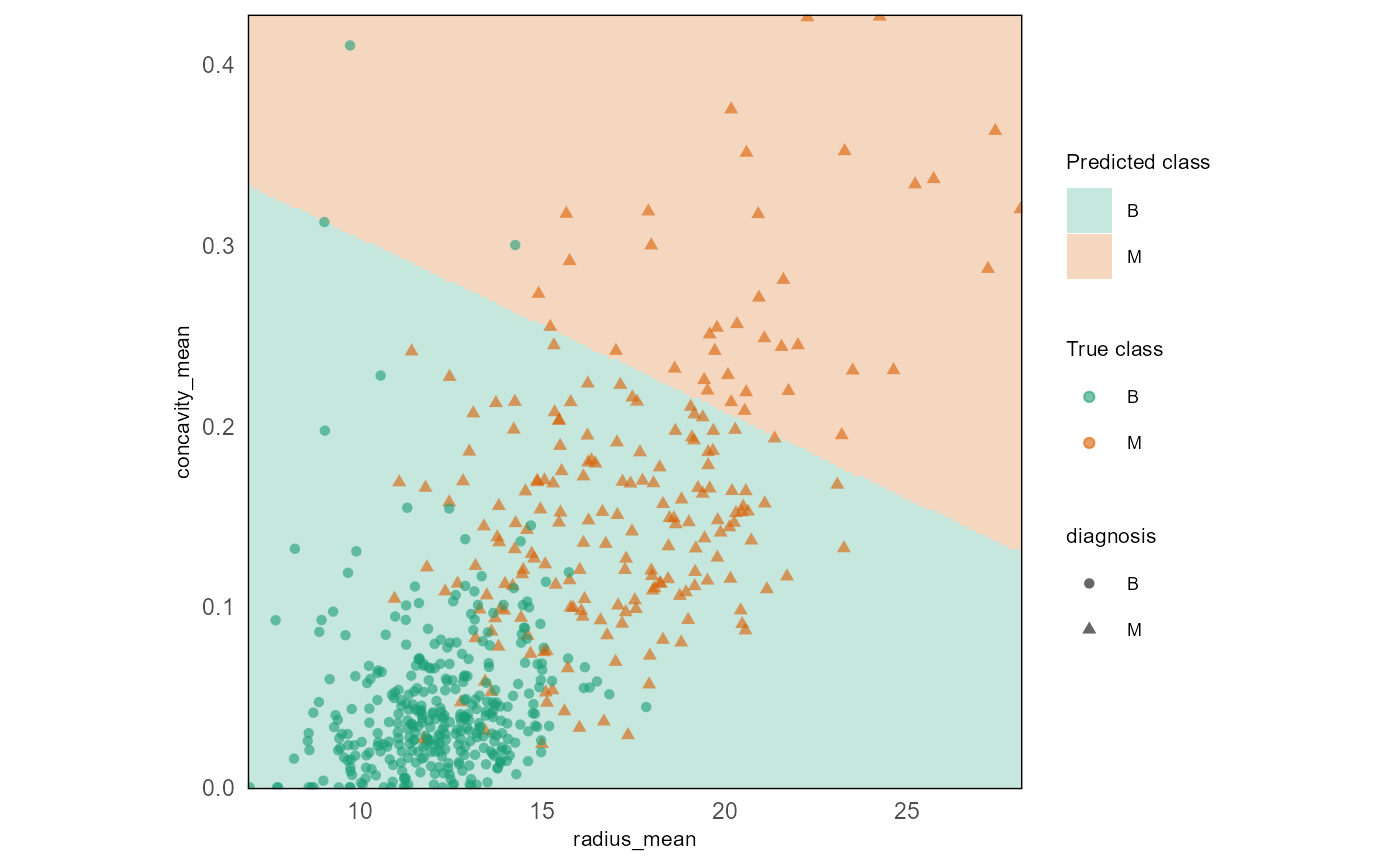
 # Surface with explicit feature axes
plot(tree,
data = wdbc, response = "diagnosis",
plot.type = "surface",
features = c("radius_mean", "concavity_mean")
)
# Surface with explicit feature axes
plot(tree,
data = wdbc, response = "diagnosis",
plot.type = "surface",
features = c("radius_mean", "concavity_mean")
)
 # }
# }